It’s that time! My 2025 spending, in color:
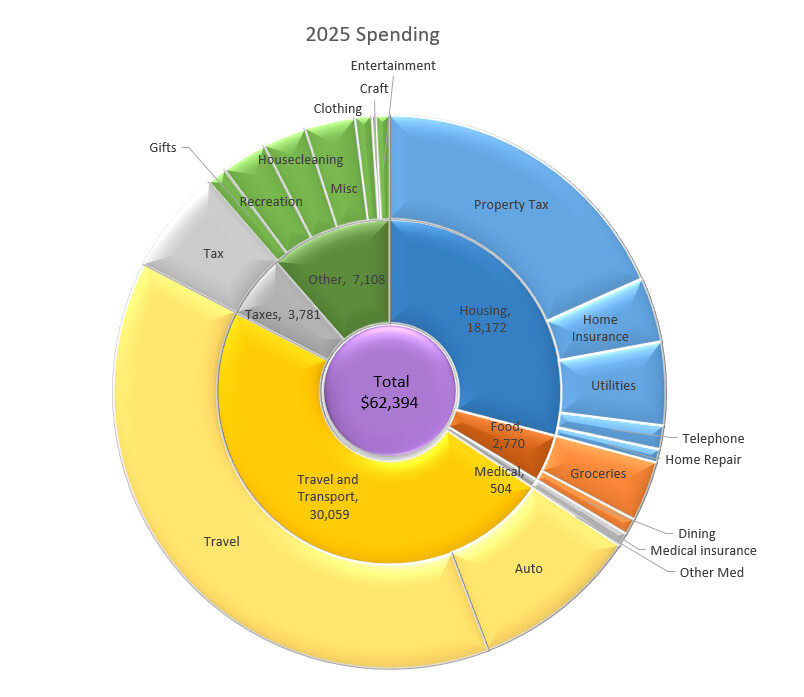
That’s a 42% increase (nearly $18,500) from last year. What changed?
The big one: travel. I had one big bucket list trip that was over $10k. I paid money for a lot of flights for my other travel since I’m low on points.
The other side of travel and transport: my 13-year-old car got over $5k in repairs to keep it chugging along.
Housing: Last year I had part of my property tax escrow refunded. This year shows the true cost of home ownership.
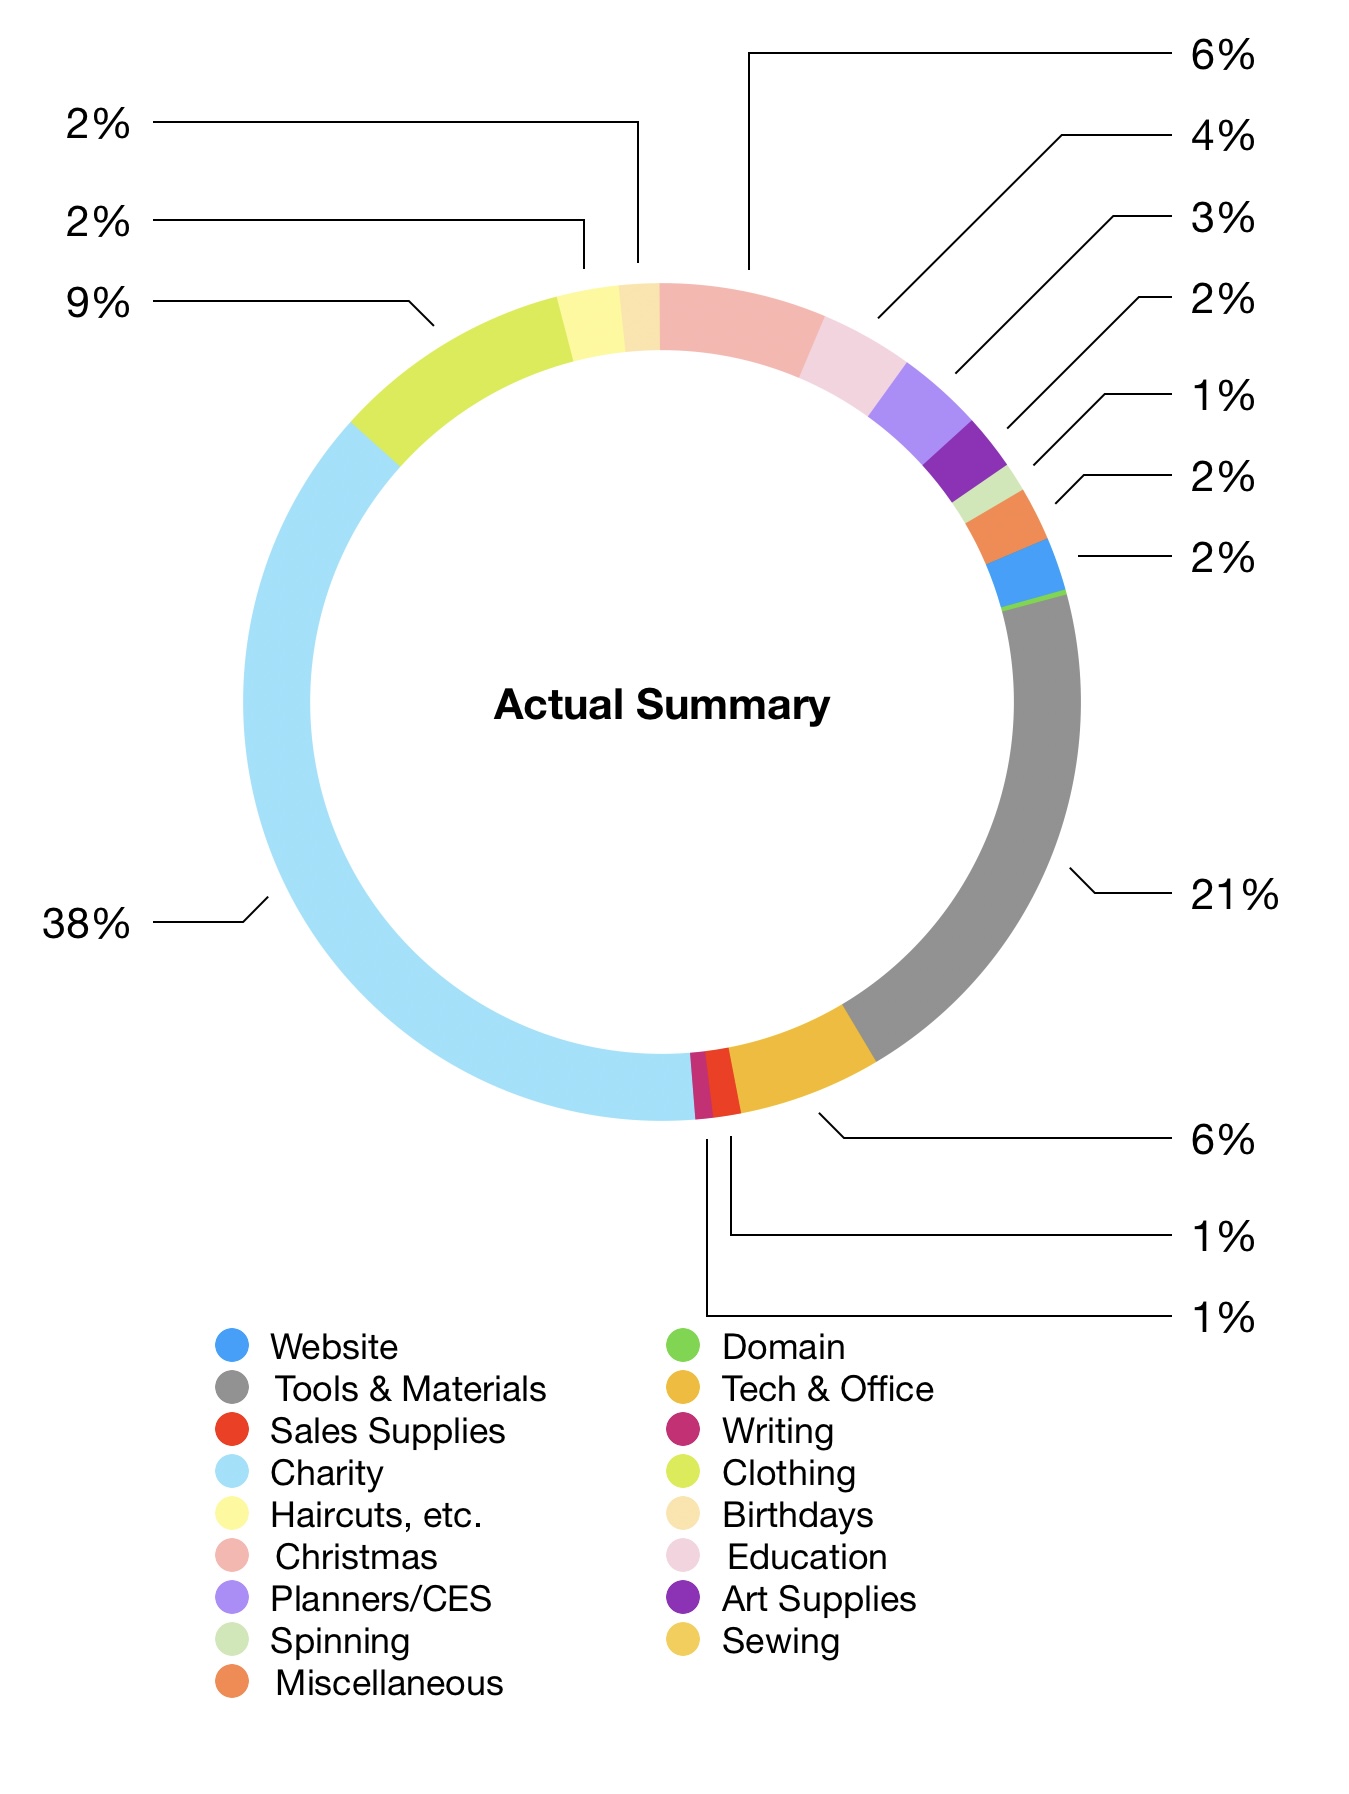
Not in the chart, because I don’t track it as an expense: my charitable giving increased 32% over last year. I wish I’d thought to compare the increase in expenses and the increase in giving - I might have tried to make the % match.
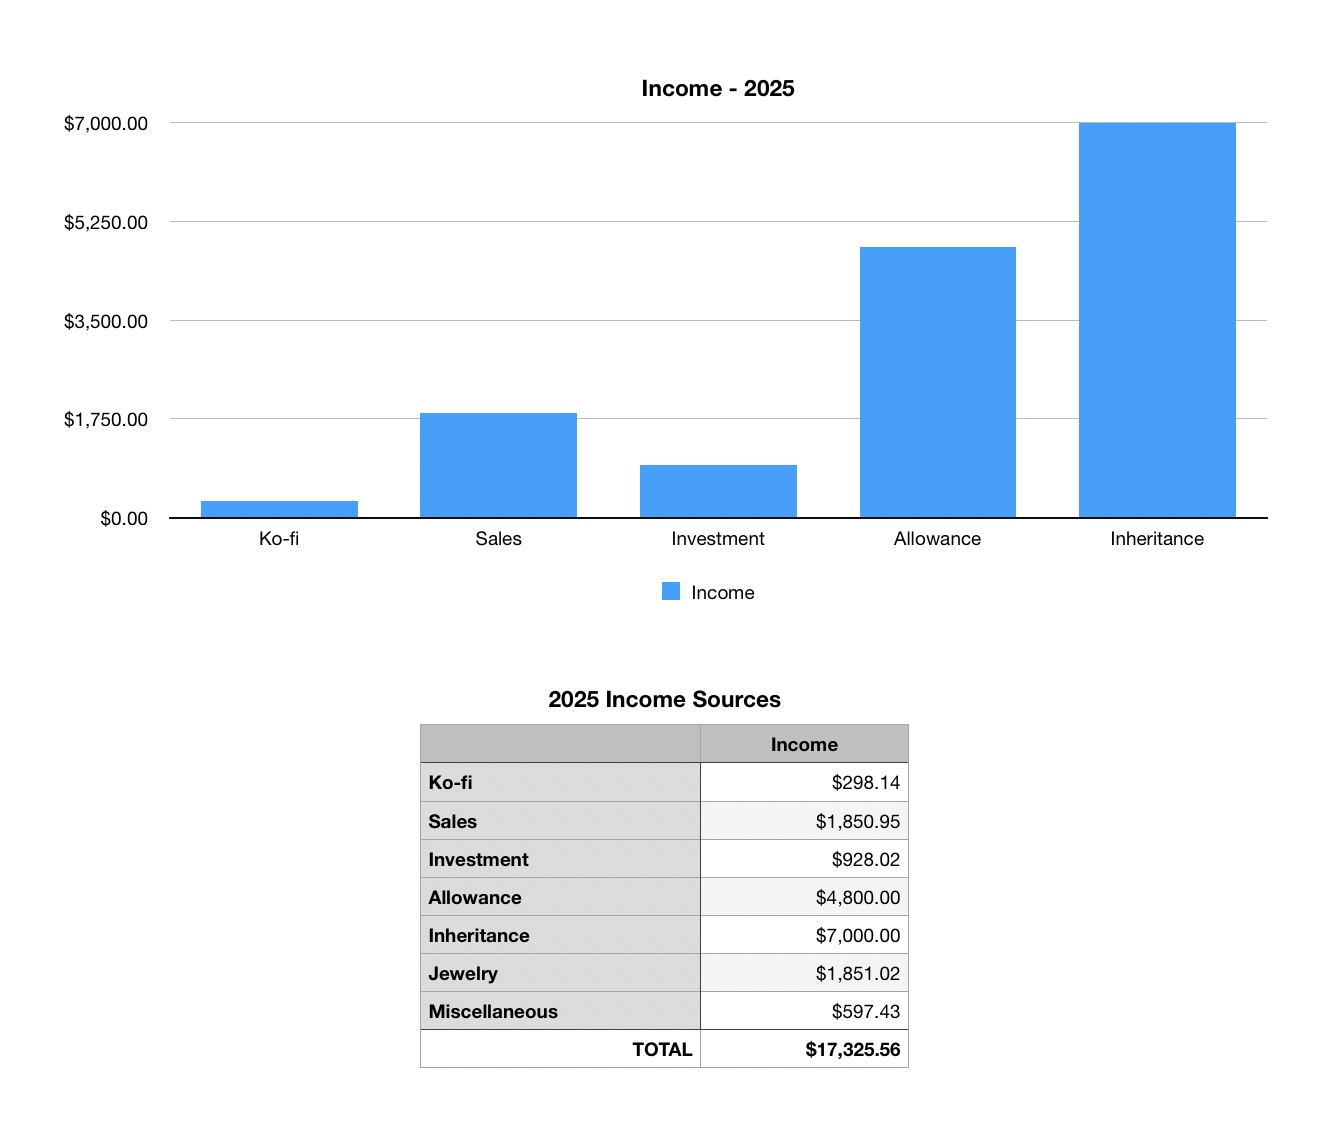
Total spending + giving was equivalent to a 3.4% withdrawal rate if based on end of year net worth or a 3.8% withdrawal rate based on beginning of year net worth.